Why Intuition Breaks Down
In a small portfolio, experience and judgment can carry you far. A seasoned credit officer knows the borrowers. The relationships are real. The patterns are visible.
What We See Across Institutions
If you have read our work on Customer Centricity, you know that we are strong advocates of client proximity and the expertise of experienced lending professionals. That is not a contradiction to what follows. In fact, it is complementary. The best relationship managers combine client insight with analytical rigor, they see the individual borrower clearly and understand where that borrower sits within the broader portfolio picture. What this series addresses is the scaling exercise: how institutions move from managing individual relationships to managing a portfolio, and from managing a portfolio to defining and steering their credit risk appetite.
The metaphor we use internally: the skilled credit officer looks at the trees. The role of credit risk management is to paint a picture of the forest.
Scale Changes the Nature of the Challenge.
When portfolios grow, when borrowers become abstractions on a spreadsheet rather than faces across a desk, when economic cycles shift, intuition needs to be quantified. The decisions that felt sound in stable conditions must now be solidified into a framework that governs the overall portfolio and defines the institution’s credit risk appetite.
This is not a failure of courage or caution. It is a failure of measurement.
“Risk does not begin with losses. It begins with how uncertainty is measured.”
— Q-Lana White Paper on Credit Risk
The Language of Credit Risk: PD, LGD, and EAD
Modern credit risk management is built on three measurable variables. They are not technical novelties, they have been at the heart of the Basel regulatory framework for decades. Yet many institutions still treat them as back-office constructs rather than front-line decision tools.
Let’s be precise about what each one actually means.
Probability of Default (PD): How Likely Is Failure?
PD answers a deceptively simple question: what is the likelihood that this borrower will fail to meet their obligations within the next year?
A PD of 5% does not mean the borrower will default. It means that among many borrowers with similar profiles, five in one hundred are expected to default over that horizon. This distinction is critical. PD is not a prediction about an individual. It is a statement about portfolio behavior.
Strong PD models reflect:
Financial strength and cash-flow stability
Business model resilience across economic cycles
Sector sensitivity and macro exposure
Observed behavioral patterns over time
When PD is poorly estimated, or treated as a box-ticking exercise, institutions systematically underprice risk. They chase growth in the wrong places and discover the cost only when defaults arrive in clusters.
▌ The executive question
When did we last validate that our PD estimates reflect reality, not the last good year?
Loss Given Default (LGD): What Does Loss Actually Mean?
Default is not the end of the story. What matters next is recovery.
LGD measures the proportion of exposure that will not be recovered after a borrower defaults. It sounds technical. In practice, it is where optimism does its most dangerous work.
Collateral looks strong on paper. Guarantees appear enforceable. Recovery assumptions quietly ignore legal delays, property market cycles, and jurisdictional complexity. During a downturn, collateral values fall precisely when you need them most.
LGD is shaped by:
Quality and liquidity of collateral — cash versus commercial real estate are not equivalent
Legal enforceability and realistic recovery timelines
Market conditions at the time of default, not at origination
Seniority and structure of the claim
Two loans with identical PDs can have radically different risk profiles if their LGDs differ. A secured loan with a higher PD may be safer in practice than an unsecured loan with a lower PD. LGD is where risk discipline meets operational reality.
“Optimism is not a risk management strategy. LGD is where it gets exposed.”
Exposure at Default (EAD): How Big Is the Problem?
EAD captures how much is actually at risk at the moment of default. This is the variable most consistently underestimated, particularly in revolving facilities.
For term loans, EAD declines predictably as principal is repaid. For credit lines, overdrafts, and guarantees, the dynamic is reversed. Borrowers draw on available liquidity before defaulting. Covenants are often breached after exposure has already expanded.
EAD reflects:
Product structure and utilization behavior
The timing and sequencing of default within the credit lifecycle
Contractual features that either limit or accelerate drawdown
Ignoring EAD dynamics leads institutions to believe they are less exposed than they are. The surprise arrives precisely when capital is most under pressure.
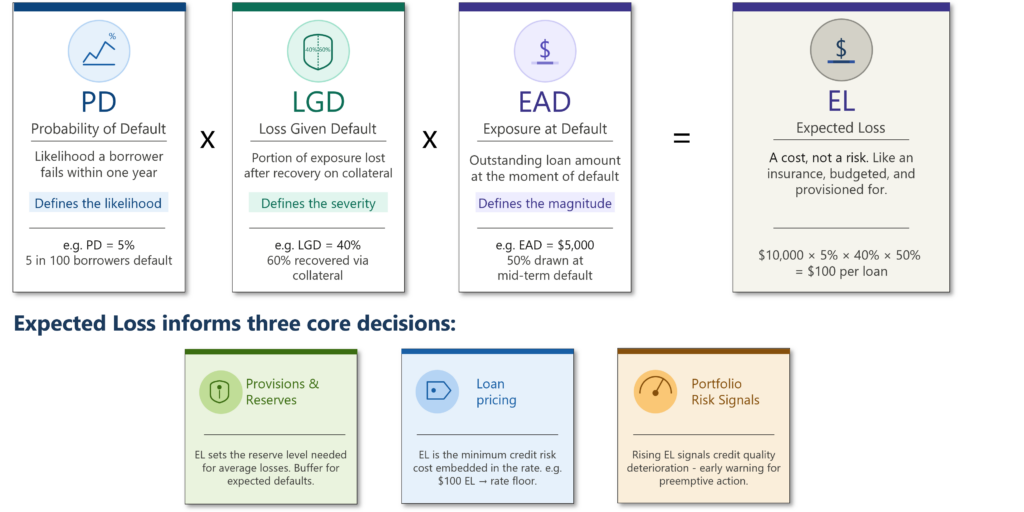
Three Variables. One Complete Picture.
Separately, PD, LGD, and EAD each answer one question. Together, they answer the only question that matters:
How much can we expect to lose, and what drives that number?
Their product forms Expected Loss: the foundational metric for provisioning, pricing, and portfolio management. But their real power is structural. They create a common language across credit, finance, and risk functions, a shared framework for comparing decisions, tracking portfolio evolution, and steering growth deliberately.
Without these measures, risk discussions remain subjective. With them, risk becomes comparable, transparent, and manageable.
From Numbers to Decisions
Here is where many institutions stop short. PD, LGD, and EAD are modelled, filed, and reviewed annually by the risk team. They rarely reach the relationship manager making a pricing decision or the credit committee debating a structure.
That is a strategic failure, not a technical one.
These metrics are not there to constrain business. They exist to ensure that growth is profitable after risk, that capital is deployed where it generates returns, and that early warning signals are visible before problems become crises.
Institutions that embed these measures directly into credit decisions do not take less risk. They take better risk. The difference, over a cycle, is decisive.
▌ Q-Lana’s approach
At Q-Lana, credit risk management is not a department function, it is a core institutional competency that runs through every product we build and every engagement we lead. PD, LGD, and EAD are not static inputs to a capital calculation. They are live variables embedded in origination, monitoring, pricing, and portfolio analytics, visible to the people making decisions, not just the team reviewing them afterwards.
▌ Q-Lana Knowledge Resources
White Paper: Credit Risk and Risk Appetite, available for download at q-lana.com. Part of Q-Lana’s three-paper Thought Leadership Series alongside Data Management and Customer Centricity.
Q-Lana Financial Skills Campus (FSC): Class 1, Credit Risk Measurement and Capital. Covers PD, LGD, EAD, Expected Loss, Unexpected Loss, and Basel capital frameworks in depth.
FSC Connected Curriculum: Courses on loan origination, risk-based pricing, and credit analysis that connect these concepts to everyday lending practice.
Coming Next
Many institutions provision correctly and still fail when conditions deteriorate. Article 2 explores why and introduces the concept that actually determines survival: Unexpected Loss.