Expected Loss: The Price of Doing Business
Expected Loss (EL) represents the average level of credit losses an institution anticipates over a given year. It is calculated from the three variables introduced in Article 1:
EL = PD × LGD × EAD
Think of it like an insurance premium. You know, on average, how many claims will arrive. You price for them. You reserve for them. In a stable environment, this works well. Defaults arrive roughly as expected. Losses are absorbed by reserves. Earnings remain smooth.
EL is a cost, not a risk indicator. It tells you what you should plan to lose. It says nothing about the range of outcomes around that plan.
“Expected Loss is the price of admission. Unexpected Loss is the price of survival.”
The Dangerous Comfort of ‘We Are Covered’
Institutions that focus on provisioning often develop a seductive narrative: we have set aside the right amount; therefore, we are prepared.
They are prepared, for normal years.
Credit losses do not arrive neatly at their average. Defaults cluster. Economic cycles turn suddenly. Borrowers fail together when a sector contracts or a macroeconomic shock reverberates through the system. The 2008 financial crisis did not materialize because banks provisioned incorrectly for average losses. It arrived because the distribution of losses was far wider than expected, and equity capital was insufficient to absorb the tail.
This is the structural limitation of Expected Loss: it describes the center of the distribution, not the extremes. Two portfolios can have identical EL and behave very differently under stress.
▌ The executive question
If default rates moved from 5% to 7% in your key segment, would your provisions cover the additional loss, or would it fall on capital?
Unexpected Loss: Where Institutions Actually Break
Unexpected Loss (UL) captures the volatility around the average. It measures how far actual losses can deviate from Expected Loss under adverse conditions.
UL is driven by:
Variability in default rates, the difference between 5% and 8% is not linear in its impact
Correlation between borrowers, sector or geographic concentration amplifies losses
Macroeconomic shocks, recessions, rate spikes, commodity collapses
Tail events, rare but decisive, occurring once in decades but capable of restructuring institutions overnight
Critically, Unexpected Loss is not covered by provisions. It is covered by equity capital. This is the fundamental distinction that many executives either do not know or choose not to engage with.
Capital exists for one reason: to absorb losses that exceed expectations. When losses remain within EL, the institution operates normally. When they exceed EL, survival depends on how much capital is available, and how it has been allocated.
“Provisions smooth earnings. Capital absorbs shocks. Confusing the two leads to complacency.”
— Q-Lana White Paper on Credit Risk
Visualizing the Risk: A Simple Portfolio Reality
Consider a portfolio with Expected Loss well understood, estimated at 5%, and fully provisioned.
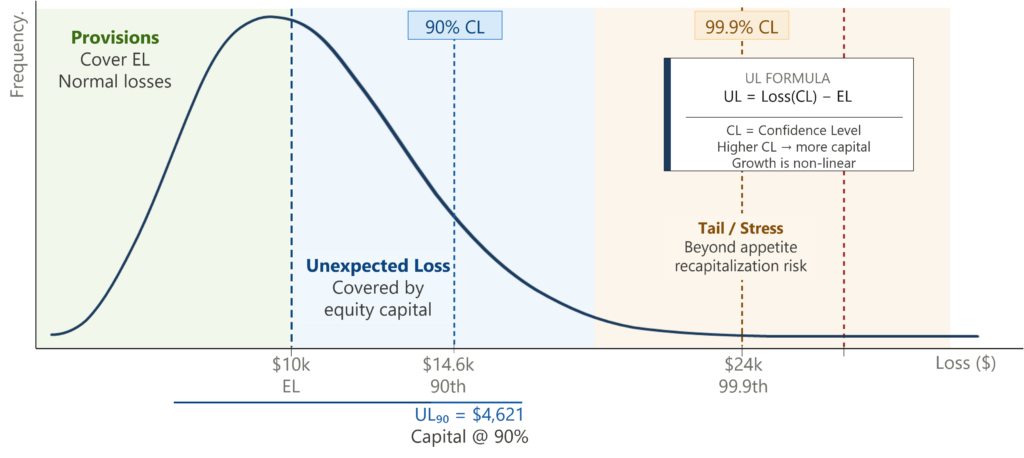
Most years, actual losses hover around that number. Management grows comfortable. Then conditions change. Instead of 5% of borrowers defaulting, 7% do. Losses rise sharply. Provisions are exhausted. The gap must be filled by capital.
That gap is Unexpected Loss
If capital is sufficient, the institution absorbs the shock and continues lending. If it is not, lending contracts, regulators intervene, and confidence erodes. This is why crises feel sudden, even when the underlying risk models were technically correct. They were modelling the center of the distribution, not the tail.
The Q-Lana White Paper on Credit Risk includes a worked Monte Carlo simulation of this dynamic across a representative loan portfolio, illustrating how loss distributions behave at different confidence levels. It is worth reading if you want to see the numbers behind the narrative.
Confidence Levels: A Strategic Choice, Not a Technical Calibration
Unexpected Loss is not a fixed number. It depends on how conservative the institution chooses to be, expressed through confidence levels:
95% confidence: losses are covered in 19 out of 20 years
99% confidence: covered in 99 out of 100 years
99.9% confidence: covered in 999 out of 1,000 years
Each step up in confidence requires disproportionately more capital. Based on Monte Carlo modelling across a representative loan portfolio, the jump from 95% to 99% requires meaningful additional equity. The jump from 99% to 99.9% is substantially more expensive still.
This non-linearity is not a flaw. It reflects reality: extreme losses are rare, but when they occur, they are severe. The decision about which confidence level to adopt is therefore not a technical question. It is a strategic one.
It is a statement about the kind of institution you intend to be.
▌ The strategic question
What confidence level does your institution operate at, and was that choice deliberate, or inherited from a regulatory minimum?
From Accounting Logic to Risk Logic
Expected Loss belongs to accounting. Unexpected Loss belongs to risk management and strategy.
The most resilient institutions treat provisions and capital as complementary tools, not substitutes. They understand that:
Provisions prepare you for normal years
Capital prepares you for abnormal ones
The decision about how much capital to hold is inseparable from the decision about how much risk to take
This is not about holding more capital for its own sake. Over-capitalization carries its own cost, in foregone returns, in competitive disadvantage, in inefficient allocation of scarce equity. The goal is calibration: capital that reflects the actual risk profile of the portfolio, held deliberately and allocated precisely.
Institutions that manage EL and UL together, not in isolation, are not more conservative than their peers. They are more intelligent.
▌ Q-Lana’s approach
Credit risk modelling is not a standalone function at Q-Lana, it is the analytical engine that runs through our platform, our advisory work, and our Financial Skills Campus curriculum. EL and UL are modelled dynamically, not as annual static snapshots. Both metrics feed directly into capital planning, pricing logic, and portfolio dashboards, so management sees not just what it expects to lose, but the range of outcomes it must be prepared to absorb.
▌ Q-Lana Knowledge Resources
White Paper: Credit Risk and Risk Appetite, the full Monte Carlo simulation and UL worked examples are available in Part 1. Download at q-lana.com.
Q-Lana Financial Skills Campus (FSC): Class 1, Credit Risk Measurement and Capital covers Expected Loss, Unexpected Loss, and confidence-level calibration.
FSC Course: Monitoring and Covenant Management, tracking credit quality deterioration in the performing portfolio before it becomes a non-performing problem.
Coming Next
If Unexpected Loss defines how much capital is needed, the next question becomes unavoidable: how should that capital be allocated, loan by loan? Article 3 explains why capital is not a regulatory burden; it is one of the most powerful steering tools a financial institution has.