The Strait That Prices Your Bread
In this thought leadership piece, we talk about how shipping blockages far from Africa can push sound borrowers into default, and argue that lenders can act early by linking free shipping data to borrowers’ trade routes. We draw on BIS research, IMF PortWatch data and Northern Corridor figures.
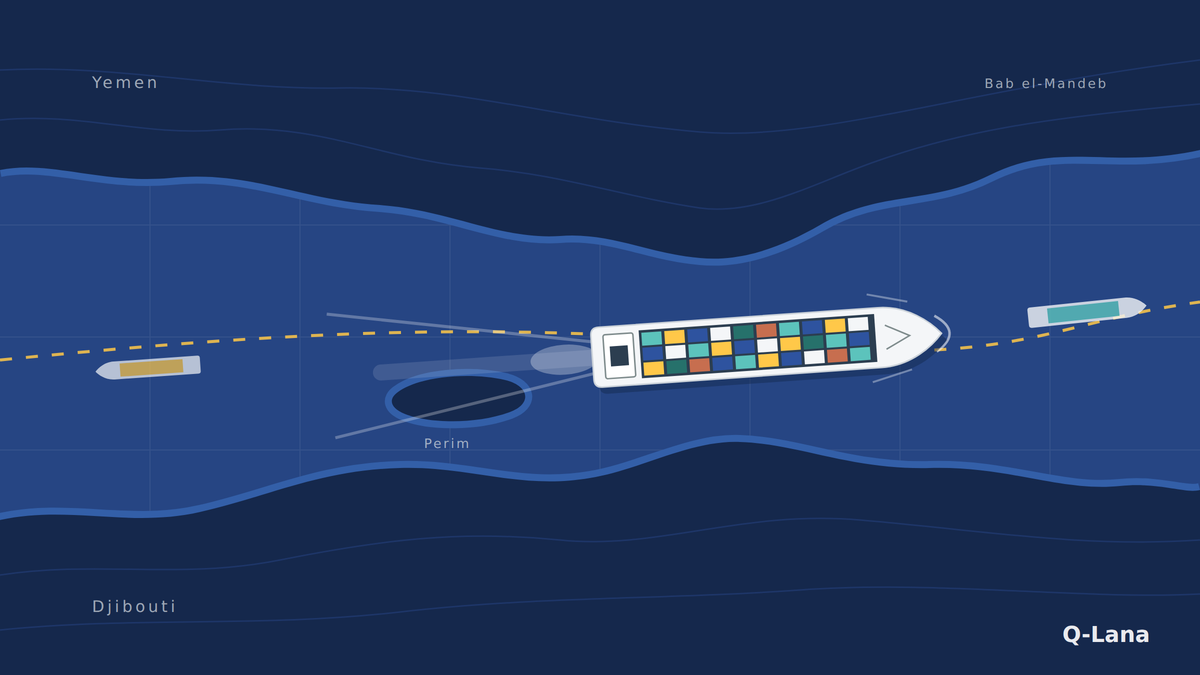
There is a stretch of water between Yemen and Djibouti, about eighteen miles across at its narrowest point. An island called Perim sits in the middle, splitting the passage into two channels. The eastern one is roughly three kilometers wide.
Through that gap passes a meaningful share of everything that moves between Asia and Europe, and a great deal of what reaches East Africa. When ships stop going through it, a bakery in Kampala pays more for flour about two months later. The baker does not know why. Neither, in most cases, does the bank that lent to him.
That gap between cause and comprehension is the thing this article is about.
The shipping is just the clearest example we have found of a pattern that shows up everywhere in African finance, and increasingly in finance generally. The people closest to the consequence are the furthest from the information.
I remember well how the first shipping crisis of this decade, at the end of the pandemic, caused the delay of solar panels reaching an East Africa-based borrower. The business was the selling and installation of the panels. With no inventory available, the borrower was unable to serve customer demand, and the team of installation experts moved on to the next company. Ultimately, it led to the default of this borrower.
-Christian Ruehmer, Co-Founder and CEO of Q-Lana
Geography as leverage
Global trade is a small number of threads passing through a smaller number of needles. Hormuz. Bab el-Mandeb. Suez. Malacca. Panama. Gibraltar. You can count the places where the world’s cargo narrows on two hands, and every one of them sits in or beside a jurisdiction with its own politics, grievances, and reasons to find leverage useful.
This is the oldest form of power. Control the pass, tax the caravan. What is new is the length of the chain behind each needle, and, therefore, the number of people who feel it when the needle closes. A sixteenth-century blockade starved a city. A twenty-first-century one reprices fertilizer on three continents and shows up, eventually, as a farmer in Kenya deciding to plant less.
What the numbers show
On 17 September, the Bank for International Settlements (BIS) published Working Paper 1378, which put numbers on the second half of that sentence. It measured actual vessel traffic through the Strait of Hormuz, separated genuine supply disruption from ordinary demand variation, and traced what followed. It finds that a typical supply-driven fall in traffic raises real energy and fertilizer prices by roughly 15% within a year, cuts global industrial output by about 1.5%, and widens emerging market sovereign spreads by around 30 basis points, with the effects visible after four to six months.
Stress arrives at the worst moment
One finding deserves more attention than it will get. The shock works as an amplifier: the wider credit spreads already are, the further the same disruption pushes them. Stress arrives hardest at the worst possible moment, which is exactly when a fragile system has the least capacity to absorb it.
Anyone who has spent time in economies that run without a buffer already knew that. It is useful to have it measured.
The asymmetry
Here is what bothers us about the distribution of this risk:
African economies are, in aggregate, structurally positioned to absorb the maximum damage from a chokepoint event and to receive the minimum warning. It follows from four specific facts.
1) Trade is overwhelmingly seaborne, with very little air or rail substitution available at any realistic price. 2) Many countries are landlocked and face transfer delays, while 3) relying on external energy and fertilizer supplies, and 4) transactions are settled in hard currencies.
The corridor problem
Several countries are landlocked and depend on a corridor through someone else's port. Cargo for Kampala, Kigali, Bujumbura, Juba, and eastern Congo comes through Mombasa or Dar es Salaam, adding an ocean delay and a road delay on top of each other. Northern Corridor reporting has put 2023 transit from Mombasa at around 109 hours to Kampala and 129 hours to Kigali, and the Shippers Council of Eastern Africa puts ship turnaround at Mombasa near 79 hours, against a global benchmark closer to 24. Those are the normal, and the disruption adds to them.
Most of the continent imports its energy and its fertilizer. Both come through the affected straits. Both are inputs to everything else.
When the dollars run out
The settlement currency is not local. This is the part that turns an inconvenience into a solvency event. When the import bill rises in dollars while export receipts are flat or delayed, reserves drain and hard currency gets rationed. A business can be entirely solvent in local terms, hold the money, and still be unable to obtain the dollars to pay a supplier. The loan fails. The cause is convertibility, an external issue more than anything else. A strait closed means that a country can run out of a currency it does not print.
We have watched institutions take a provision for that and file it under borrower deterioration. The borrower was sound, the country/conversion risk is the issue.
The part that is actually in our hands
It would be easy to end there, and it would be dishonest, because the framing so far makes Africa a passive recipient of other people’s geography. That is only half true, as it is possible to manage the situation proactively.
The IMF publishes PortWatch. It tracks 28 chokepoints using satellite signals from roughly 90,000 vessels, it updates weekly, and it costs nothing. Anybody with a browser can look at it. The container freight indices are published. Port authority data exists. The fertilizer price is not a secret.
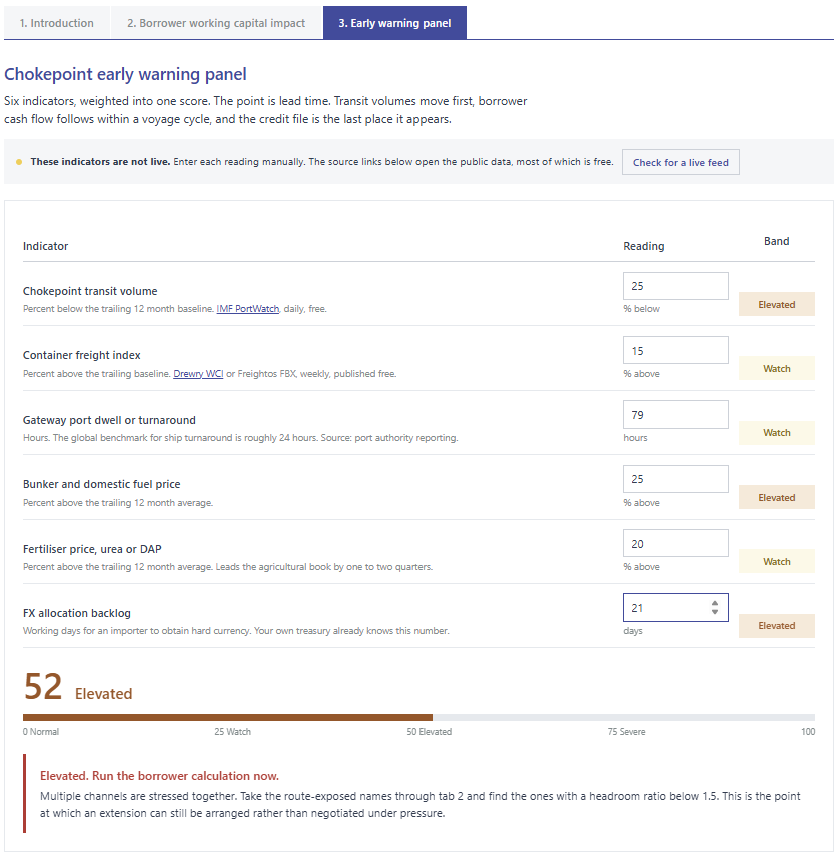
The information is openly available, but it is often ignored by institutions that would benefit from it.
Why the data goes unused
We want to be careful here, this is not about a lack of willingness of capacity. Credit teams across the entire continent are highly capable. We have worked with risk functions in Nairobi, Kigali, Kampala, Lagos and other centers that are as rigorous as anything in Frankfurt. Often, they are considerably more inventive, because they have to be. The reason though is structural, and it is the same reason everywhere.
A credit file records what a borrower is and leaves out how a borrower’s goods arrive. Route, origin, corridor and input concentration are missing from every loan analysis and are not properly tracked. The information remains inside letters of credit, bills of lading, invoices and foreign exchange applications, which is to say they sit inside documents the bank has already read, already processed, and already filed. The institution possesses the information. Due to the lack of capable Loan Management Tools, it cannot query it.
A problem we can solve
The chokepoint data has nowhere to be useful. You can watch Bab el-Mandeb traffic fall by 40% and be unable to answer the only question that matters: which of my borrowers is behind that strait?
That is a solvable problem. It requires effort and is slow to fix, but it is solvable, and it is solvable by decision rather than by permission. No regulator has to approve it. No donor has to fund it. It is the kind of constraint an institution can simply choose to remove. You need to use smarter Loan Management systems like Q-Lana, which collects/stores/assesses information.
What resilience actually is
Resilience is badly understood, in finance and elsewhere. It is usually described as strength, buffer, or diversification. Those help. But the institutions we have seen come through shocks best were the ones that understand the causes/effects better and had decided in advance what they would do when a specific number moved.
That is a different quality. It is closer intellectual capacity than a technical one. It requires admitting, while things are calm, that you are exposed to something you do not control. Most organizations find that admission difficult, because naming an exposure you cannot eliminate feels like a confession of weakness rather than an act of governance. So, the exposure goes unnamed, and when it arrives, everyone treats it as a surprise.
Prudence as clear sight
It was unexamined. The difference between a surprise and an unexamined risk is almost entirely a question of institutional character.
There is an old idea, considerably older than banking, that prudence differs from caution. Prudence is the capacity to see what is actually in front of you and act accordingly, which sometimes means moving faster than caution would advise. A bank that names its route concentration and sets a limit against it is being clear-eyed about a dependency it has, and clarity is the precondition for acting well under pressure.
The alternative is to keep discovering the same exposure every time, and to call the discovery bad luck.
Quantify the issue
There is also a practical aspect that allows for quantification and immediate action to support customers and position your bank as a competent partner that understands the business. A delay changes how much cash is trapped in goods that have not arrived. Annual cost of goods (COGS) divided by 365 gives you the daily cost. Multiply this by the extra transit days. This gives you the additional working capital that the borrower now needs. Compare it to their undrawn committed lines. If the ratio is below one, they cannot fund the delay from existing facilities, while nothing else about their business has changed. That is a twenty-minute calculation, and most banks are not doing it.
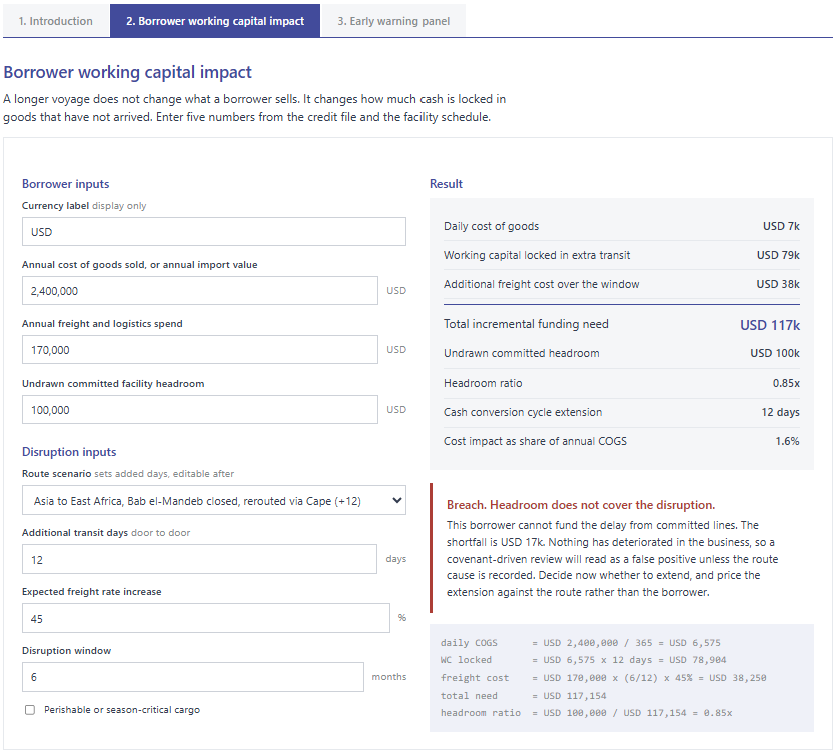
Twelve extra days at sea leave this importer USD 17,000 short, although nothing in the business has changed. Illustrative figures.
Who gets to be early
The larger point is about who gets to be early.
Being early is usually treated as a function of resources. Better data, better systems, better analysts. Sometimes that is true. However, in this case, the data is free, the calculation is arithmetic, and the constraint is whether an institution has decided that a number generated four thousand miles away is its business.
That decision is available to a bank in Kigali on the same terms as to a bank in London. It may in fact matter more in Kigali, because the consequence lands harder there and the buffer is thinner. Proximity to consequence ought to confer authority. At the moment it mostly confers exposure.
The ships are your business
Asymmetry is temporary, and anyone can choose to close it. It requires deciding that the ships are your business, and then building the one boring thing that lets you act on it: knowing which of your borrowers is behind which strait.
Everything else is arithmetic.
At Q-Lana, topics like this excite us. We love to find ways to better support the banking activities of our clients and of the industry in general. That's why you will find blog articles like this on our website, you can read our whitepapers and join classes on our Financial Skills Campus.
A tool for you
We also share our models with you. We have published a working model of both calculations, the borrower-level working capital translation and a weighted early warning score built on public data sources. It is free to use, and the assumptions are visible on the face of it.
To open it, log in with:
- Username: Public_User (or publicuser@q-lana.com)
- Password: Blog@2026
The technical version of this argument, written for credit risk practitioners, is in this week’s Q-Lana Signal.
The early warning panel: six public indicators, one score, and the lead time before stress reaches the credit file.
Put this to work
Run the numbers, test our tools
Test your most route-exposed borrowers. It takes about twenty minutes and needs five numbers from the credit file. (Username: Public_User (or publicuser@q-lana.com), Password: Blog@2026)
Get our research by email.
Join the Q-Lana mailing list. New analysis on SME Finance, Credit Risk Management, Digital Transformation, Microfinance and Agri-finance. Free, no paywall.
Keep learning.
Free white papers on credit risk and data management are in the Q-Lana Knowledge Center.