
Expected Loss Is a Cost Every Loan Must Cover
This is Article 2 of 5 in the Q-Lana Risk Management series. Expected loss is a cost every loan must cover. A worked loan shows how it sets provisions, the pricing floor and early warning. It also shows why provisions rarely match the actual year.

Expected loss is the average cost of lending, and it belongs in the price of every facility. Multiply the probability of default (PD), loss given default (LGD) and exposure at default (EAD) to get it. A loss the bank expects is not a surprise. Banks that leave it in the risk report misprice every facility they write. This article shows how expected loss should drive provisions, pricing and early warning, using one worked loan.
How Institutions Usually Treat Expected Loss
Most institutions treat expected loss as a risk metric, calculated by the risk function, reported to a committee, and filed. That is a category error with a cost attached. Expected loss is not a measure of danger. It is the average cost of being in the lending business, and it belongs in the price.
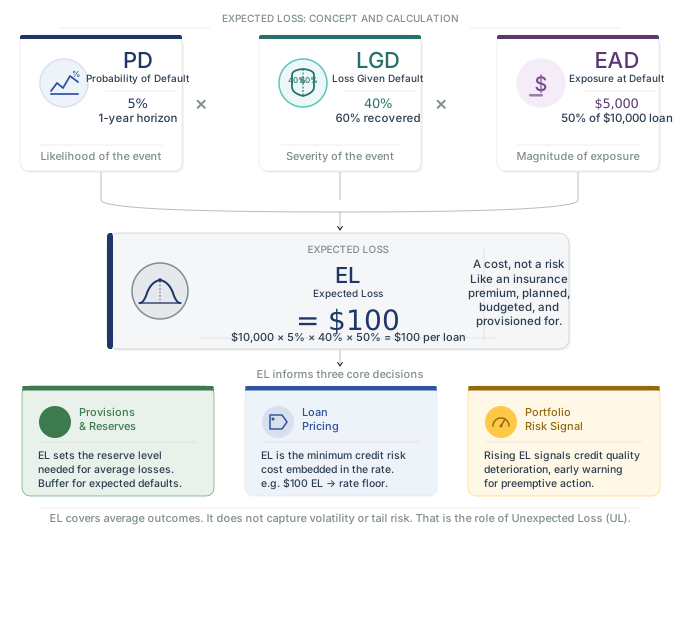
Expected Loss Works Like an Insurance Premium
Insurance offers the right comparison. An insurer knows roughly how many claims will arrive each year. It does not treat those claims as a risk. It prices them into the premium, reserves against them and moves on. Its risk is the year that turns out worse than average. That is a different problem with a different answer.
A lender's expected loss works the same way, with three consequences.
i. It sets provisions
Expected loss guides the reserve level required to absorb average losses. Under IFRS 9 expected credit loss rules, provisions build on the same PD, LGD and EAD inputs. These reserves absorb ordinary defaults and keep the bank solvent through a normal year.
ii. It sets the floor under pricing
If a facility carries 100 of expected loss, that $100 must appear in its interest or fees. It must be covered in that specific loan, not on average across a segment. In that loan. A rate that does not clear its own expected loss is a decision to lose money slowly, and it is usually taken by someone who never calculated the number. Risk-based pricing starts here.
iii. It gives early warning on portfolio health
Rising expected loss across a segment signals trouble well before arrears appear. It is one of the few risk indicators that leads rather than lags.
What expected loss does not do is measure
Expected loss says nothing about variability or extreme outcomes. That is the subject of the next article. Confusing the two is how institutions end up well provisioned and undercapitalized at the same time.
Expected Loss on One Loan Worked Through
Take a portfolio of $100 identical loans. Each is $10,000, over four years, amortizing in a straight line. Probability of default is 5%. Collateral worth $3,000. Default is assumed to occur on average after two years.
Exposure at Default
Straight-line amortization puts the midpoint exposure at half the original amount: 5,000.
Loss given Default
Against exposure of $5,000, collateral of $3,000 leaves $2,000 lost. That is 40%.
Expected loss
$10,000 × 5% × 40% × 50% = $100 per loan.
Now two questions that expose whether the concept has landed.
The loss if one loan defaults
If one loan actually defaults, the loss is not $100. The probability has already resolved. Therefore, PD drops out of the calculation entirely. The loss is $10,000 × 40% × 50% = $2,000. Expected loss is a portfolio figure, even when it is quoted per loan.
Expected loss for the whole portfolio
Across 100 loans, expected loss is $100 per loan, or $10,000 in total. That is the amount the institution provisions.
Why Are Provisions Based on Expected Loss Correct on Average and Wrong Every Year
Here is where the concept earns its keep.
The good year and the bad year
Suppose 4 loans default instead of 5
Total loss is 4 × $2,000 = $8,000, against provisions of $10,000. A surplus of $2,000. In many institutions that surplus is quietly reclassified as profit and distributed to shareholders and staff.
Suppose 6 default
Total loss is $12,000. Provisions cover $10,000, and the remaining $2,000 comes out of equity capital.
How often the average year happens
Read those two together. In the good year, the buffer is spent. In the bad year, the buffer is short. And nothing in the expected loss calculation warned anyone that either outcome was likely, because expected loss is silent on variability by construction.
Widen the range, and the point sharpens. If defaults run between 3% and 7%, portfolio losses swing between $6,000 and $14,000, against a single provision of $10,000. The average is right. The average is also a year that almost never happens.
What Moves Expected Loss in Real Portfolios
Three things push real portfolios away from the clean example. Each is a reason to recalculate expected loss regularly instead of assuming it.
i. Heterogeneity
Real books hold different structures, collateral types and borrower profiles. Expected loss has to be calculated per loan or per segment and then aggregated, not estimated once at portfolio level and allocated back. Averages applied downward hide exactly the loans worth knowing about.
ii. Moving inputs
Loss given default and exposure at default are not fixed at origination. Collateral depreciates, legal timelines lengthen, borrowers draw down. An expected loss calculated at approval and never revisited becomes a historical artifact.
iii. Correlation
Expected loss assumes defaults are independent. They are not. They cluster in downturns and within sectors. Expected loss itself does not capture that, which is not a flaw in the metric so much as a boundary on it, and the boundary is precisely where the next article begins.
Building This in Your Team
The Q-Lana Financial Skills Campus runs a credit risk measurement course for credit teams and risk functions. It covers rating and scoring design and calibration to observed default rates. It also shows how PD, LGD and EAD connect through to pricing and capital. The course is taught on your own portfolio.
The Test Worth Applying
Take any facility approved last quarter and ask one question. Can someone state its expected loss and show where that figure sits in the price?
If they can, the institution is pricing credit. If the answer is that risk calculates it separately and pricing is set by the market, the institution is taking credit risk and hoping the margin covers it.
Both institutions will look the same for several years. They will diverge in the first bad one, and the divergence will be attributed to the cycle rather than to the practice.
The next article is about that bad year: what sits beyond the average, why provisions do not reach it, and how much capital it actually takes.
Next in This Series
The next article, Loan Loss Provisions Are Not Enough to Protect the Bank, looks at that bad year. It covers what sits beyond the average and how much capital it takes.
Try The Expected Loss Calculator
The worked example above takes four inputs and returns a number. So does the calculator, and it will show you what happens to the price when the probability moves by a point.
Open the Expected Loss calculator
The full treatment, with the portfolio scenarios and the bridge to unexpected loss, is set out in the Q-Lana white paper Credit Risk and Risk Appetite.
Download the white paper
All the Articles in This Series:
- Credit Risk Measurement Should Come Before Instinct
- Expected Loss Is a Cost Every Loan Must Cover (this article)
- Loan Loss Provisions Enough to Protect the Bank
- Is Loan-Level Capital a Constraint or a Signal?
- RAROC Separates Good Lending From Profitable Lending
Follow Q-Lana
One short email a week on credit risk, lending and impact finance, free. Or browse more guides in the Q-Lana Knowledge Center.
Get Q-Lana Weekly
One short email a week on credit risk, lending and impact finance, free. Or browse more guides in the Q-Lana Knowledge Center.