
Is Loan-Level Capital a Constraint or a Signal?
This is Article 4 of 5 in the Q-Lana Risk Management series. Loan-level capital allocation shows how much equity each facility consumes. It compares the standardized and IRB approaches and works one loan through the Foundation IRB formula.

Loan-level capital allocation is a signal. It shows how much equity each facility consumes, a figure most credit teams never see. Lending teams usually describe capital in one of two ways. Some treat it as a regulatory ratio that limits growth. Others treat it as a number finance calculates each quarter. In practice, capital is consumed one loan at a time, through structuring choices made at origination. This article works through the Foundation IRB calculation for one loan. It then shows what the result means for pricing, tenor and portfolio steering.
How Lending Teams Usually See Capital
The first view treats capital as an external imposition: a ratio to satisfy and a brake on growth. The second treats it as another department's job. Finance calculates it centrally and reports it quarterly, well after the credit decision.
Both views place capital outside the lending decision. Consider a credit committee extending a tenor from three to five years. The aim is to make the instalment fit the client's cash flow. Nobody in the room discusses capital. Yet that single change raises the capital the facility consumes. The RM negotiating the tenor rarely knows this.
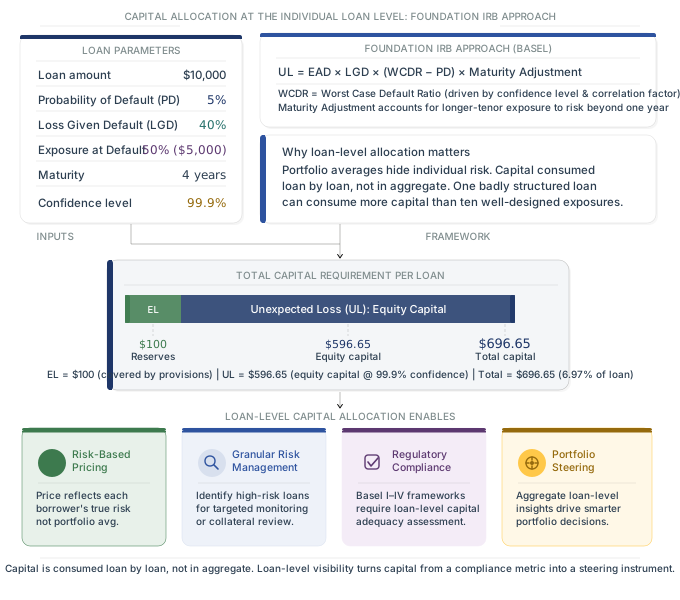
The Individual Loan is the Right Unit: Here's the Reason
Portfolio capital is easy to calculate and easy to misread. Averages hide the loans that most need attention.
Averages hide the costly loans
Two facilities of the same size in the same sector can consume very different amounts of capital. The difference comes from probability of default (PD), collateral quality and maturity. Take two $10,000 loans to food distributors. One borrower is rated in the top grade, with a short tenor and good collateral. The other sits two grades lower, with a longer tenor and weak security. At portfolio level they look identical. At loan level, the second may consume several times the capital of the first.
What loan-level figures let the bank decide
Loan-level figures show which loans should be repriced or restructured. They also show which clients the bank should compete hardest to win. An institution that knows only its aggregate capital cannot make any of these decisions with confidence.
Standardized and Internal Ratings-based Approaches
The Basel framework offers two routes to a capital figure. The choice says a lot about how well an institution knows its own borrowers.
The standardized approach
The standardized approach applies risk weights set by the regulator for each asset class. Many regulators still apply a flat 100% weight to SME corporate loans. The revised Basel standard lowers this to 85% for unrated SME corporates.
At 100%, a $10,000 SME loan becomes $10,000 of risk-weighted assets. At the 8% Basel minimum capital requirement, the bank holds $800 of capital against it. With buffers, many banks hold closer to 10%, or $1,000. The approach is simple and easy to defend. It also treats the strongest and weakest borrowers in the segment exactly the same.
Foundation and Advanced IRB
The internal ratings-based (IRB) approach lets the institution use its own risk estimates. Under Foundation IRB, the bank estimates PD. It takes regulatory values for loss given default (LGD) and exposure at default (EAD). Under Advanced IRB, it estimates all three, subject to strict supervisory validation.
The trade-off between the two
The standardized route costs little to implement but prices every borrower in a class the same way. In effect, the bank overcharges its best clients and undercharges its weakest. The IRB route requires data, models and validation. In return, the bank can price what it actually knows about each borrower.
The Basel III final reforms, often called Basel IV, moved some exposures back toward standardized treatment. Supervisors were concerned about model complexity and inconsistent results across banks. The underlying logic still holds. Capital should track the risk in each exposure. A bank that cannot tell borrowers apart will lose its best relationships to a competitor that can.
The Foundation IRB Formula Behind Loan-Level Capital Allocation
Under Foundation IRB, unexpected loss (UL) for an individual loan is calculated as follows.
UL = EAD × LGD × (WCDR − PD) × Maturity Adjustment
EAD, LGD and PD were covered in earlier articles in this series. The worst-case default rate (WCDR) and the maturity adjustment need more explanation.
The worst-case default rate
WCDR is the default rate at the chosen confidence level, derived from a normal distribution. It represents the borrower's default probability under stress, not in an ordinary year. The formula subtracts ordinary PD from it. What remains is the unexpected portion of loss, which provisions do not cover.
The maturity adjustment
The maturity adjustment reflects the extra risk of exposures lasting longer than one year. Longer loans need more capital. Take a borrower with a 5% PD. Moving effective maturity from 2.5 to 4 years raises the adjustment by about 12 per cent. RMs who extend tenors to make instalments fit should know this.
The fixed correlation assumption
WCDR includes a regulatory correlation factor, set by asset class. It reflects how borrowers tend to default together in a downturn. The Foundation formula does not let the bank use its own view of that correlation. It also assumes a large, well-diversified portfolio. In a concentrated book, that simplification can understate risk significantly.
One Loan Through the Full Calculation
Take the loan carried through this series. 10,000, four years, probability of default 5 per cent, loss given default 40 per cent, exposure at default 50 per cent, confidence level 99.9 per cent.
Expected and unexpected loss
Expected loss is $10,000 × 5% × 40% × 50% = $100. Covered by provisions.
Unexpected loss, through the Foundation IRB formula, comes to approximately $596.65. Covered by equity.
Total capital requirement: $696.65, of which just under 15% is the provision and just over 85% is equity.
What does the split tell the credit committee?
Credit committees usually discuss expected loss, the $100 covered by provisions. That figure is only about one-seventh of the capital the facility consumes. The larger share, almost $600 of equity, rarely appears in the credit paper. Adding that one line to the paper changes the pricing discussion.
Loan-Level Capital Allocation Changes Pricing and Steering in This Manner
Loan-level figures change three things in how the bank lends.
i. Pricing to each borrower's risk
The calculation reflects each loan's own risk profile. Riskier loans can then be priced to compensate, and safer loans priced competitively. A bank that prices from a segment average subsidizes its weakest borrowers with its strongest. Over time, the strongest borrowers notice and move to a lender that prices them fairly.
ii. Concentration needs a portfolio overlay
The fixed correlation in the formula does not reflect concentration in the bank's own book. Suppose 30% of a portfolio is lending to maize traders in one region. A poor harvest would hit many of those borrowers at once. Loan-level capital figures should therefore not simply be added up. Portfolio monitoring needs a concentration overlay by sector and region.
iii. Confidence level reaches the individual facility
As the previous article showed, the confidence level drives capital in a non-linear way. The board sets that level when it approves the risk appetite framework. The choice then flows into every facility the bank writes. An RM negotiating tenor is working within a capital consequence set at board level, usually without knowing it.
Building This in Your Team
The Q-Lana Financial Skills Campus runs a credit risk measurement course for credit teams and risk functions. It covers rating and scoring design and calibration to observed default rates. It also shows how PD, LGD and EAD connect through to pricing and capital. The course is taught on your own portfolio.
Data Governance Behind Capital Inputs
Loan-level capital is only as reliable as the PD, LGD, EAD and maturity data behind it. Data governance decides who owns each input, where it comes from and how often it is checked.
Rating data behind PD
PD comes from the borrower's internal rating, therefore, rating data must be complete and current. A borrower rated three years ago carries a PD that no longer reflects its business. Data governance rules should set a maximum rating age, for example, twelve months. Every rating override should be logged with its reason and approver. Credit risk can then test whether overrides cluster in one segment or with one RM.
Collateral and exposure data behind LGD and EAD
LGD depends on collateral values, and those values age quickly. A property valued five years ago gives a misleading LGD, so revaluation dates need tracking. EAD depends on limits and current utilization. If limits sit in one system and drawings in another, EAD will be wrong. Sound data governance fixes one source and one owner for each field. The BCBS 239 principles set similar expectations for risk data aggregation.
Starting Loan-Level Capital Allocation Without New Systems
The formula above runs in a spreadsheet. "We do not have the systems" is the most common reason institutions never start. At the level of a single facility, that reason does not hold.
Where systems genuinely become necessary is at scale: large and diverse portfolios, many collateral structures, stress testing against macroeconomic shocks, and keeping the numbers current rather than recalculating them for a board pack twice a year. Those are real constraints and they arrive later than most people assume.
What does not require a system is the decision to know, for a single facility, how much capital it consumes and whether the price reflects it.
Which is the question the next and final article in this series answers, by putting the capital number in the denominator and asking whether the loan is worth writing at all.
Next in This Series
The final article in this series puts the capital figure into the denominator of RAROC. It then asks whether the loan is worth writing at all.
Test One Facility in the Calculator
The most useful thing you can do with this article is take one real facility and run it under all three approaches. The gap between the standardized number and the internal one is the value of knowing your own borrowers. Please find here our capital requirement calculator.
Q-Lana · Risk Management
Basel Capital Requirement Calculator
The same loan, three ways. Watch how much capital the Standardised, Foundation IRB and Advanced IRB approaches each demand, and where internal models start to pay for themselves.
The loan
Foundation IRB uses
Advanced IRB uses your own
Capital required on this loan
| Measure | Standardised | Foundation IRB | Advanced IRB |
|---|
The full derivation, with the worked example and the key observations, is set out in the Q-Lana white paper Credit Risk and Risk Appetite.
All the Articles in This Series:
- Credit Risk Measurement Should Come Before Instinct
- Expected Loss Is a Cost Every Loan Must Cover
- Loan Loss Provisions Enough to Protect the Bank
- Is Loan-Level Capital a Constraint or a Signal? (this article)
- RAROC Separates Good Lending From Profitable Lending
Follow Q-Lana
One short email a week on credit risk, lending and impact finance, free. Or browse more guides in the Q-Lana Knowledge Center.
Get Q-Lana Weekly
One short email a week on credit risk, lending and impact finance, free. Or browse more guides in the Q-Lana Knowledge Center.