Quantifying Credit Risk Using PD, LGD and EAD
This is the first article in our Credit Risk Management series, introducing Probability of Default (PD), Loss Given Default (LGD), and Exposure at Default (EAD), and how they help quantify potential losses and support better credit decisions.

Quantifying credit risk is a cornerstone of effective risk management for financial institutions. By breaking credit risk into measurable components, institutions gain the ability to assess, price, and manage their exposures with greater precision.
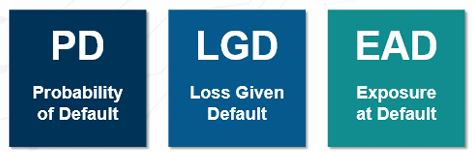
This chapter introduces the three foundational variables: Probability of Default (PD), Loss Given Default (LGD), and Exposure at Default (EAD).
Quantifying Credit Risk Using Probability of Default (PD)
The Probability of Default (PD) represents the likelihood that a borrower will fail to meet their financial obligations within a specific time frame—typically one year. Expressed as a percentage, the PD provides an estimate of the risk of default for individual loans or an entire portfolio.
What PD Tells You About Credit Risk
If a loan has a PD of 5%, it means there is a 5% chance that the borrower will default within the next 12 months. Similarly, in a portfolio of 20 loans with the same PD, one would expect, on average, one default over the same period. While this is a simplified view, it illustrates how the PD helps quantify the likelihood of non-payment and enables institutions to make informed decisions.
How Do You Estimate PD?
Determining the PD involves predictive models that assess the creditworthiness of a borrower. These models are often based on historical data, financial performance indicators, and borrower-specific factors. Institutions use tools such as credit scoring and rating systems to classify borrowers into risk categories. For instance, high-quality borrowers with stable financials may have a low PD, while riskier borrowers with weaker credit profiles will likely have a higher PD. While PD values provide a probabilistic measure of risk, they are often calibrated to reflect real-world default rates observed over time.
Quantifying Credit Risk Through Loss Given Default (LGD)
The Loss Given Default (LGD) represents the portion of a lender's exposure that is likely to be lost if a borrower defaults, after accounting for recoveries from collateral or other mitigation mechanisms.
For example:
If a lender has an outstanding loan of $10,000 and expects to recover $6,000 from collateral, the LGD is 40%.
Factors That Influence LGD
1. Collateral
The type, quality, and liquidity of collateral play a significant role. High-quality, liquid collateral (cash, government securities) reduces LGD; illiquid or complex collateral (e.g. real estate in foreign jurisdictions) makes recoveries slower and less predictable.
2. Market Conditions
During economic downturns, collateral values often decline, leading to higher losses.
3. Recovery Time
Lengthy enforcement or legal proceedings can erode the value of recoveries due to holding costs, depreciation, or other expenses.
LGD is inversely related to the Recovery Rate, which represents the percentage of exposure recovered after default, or expressed as an equation:
LGD = 1 – Recovery Rate.
For instance, if LGD is 40%, the Recovery Rate would be 60%, indicating that 60% of the exposure is expected to be recovered. Understanding LGD helps lenders prepare for loss scenarios and assess the effectiveness of risk mitigation strategies such as collateral management and legal recovery processes.
Quantifying Credit Risk Using Exposure at Default (EAD)
Exposure at Default (EAD) represents the outstanding loan amount or credit exposure expected at the time a borrower defaults. In essence, it quantifies the portion of the loan or credit facility that is likely to be utilized when a default occurs. EAD is a critical component in assessing potential credit losses and determining the capital requirements needed to mitigate risk. The value of EAD varies depending on the type of credit product and when in its lifecycle the default occurs.
What EAD Represents
For term loans, which have fixed repayment schedules, EAD typically decreases over time as the loan is amortized. For example, halfway through a loan’s tenure, the EAD is generally around half of the original loan amount, assuming consistent repayment patterns.
For revolving credit facilities, such as credit lines or overdrafts, EAD is usually assumed to be the full limit of the facility. This is because borrowers often maximize their utilization of such facilities before defaulting, leading to a higher exposure at the point of default.
Several factors can influence EAD, including the specific contractual terms of the loan. Features, such as prepayment clauses or financial covenants can help limit the exposure and reduce potential losses
Key Drivers of EAD Estimation
Accurately estimating EAD requires careful analysis of borrower behavior, particularly in areas such as:
Utilization patterns: How borrowers typically use revolving credit facilities, including trends in drawing down available limits.
Prepayment trends: The frequency and timing of early repayments for term loans.
Timing of default: The point within the credit facility’s lifecycle when defaults are most likely to occur.
EAD in the Context of Credit Loss Estimation
EAD, along with Probability of Default (PD) and Loss Given Default (LGD), forms the foundation for estimating potential credit losses. Each of these variables contributes a distinct perspective to the overall risk assessment:
- PD quantifies the likelihood of default.
- LGD measures the extent of losses when a default happens.
- EAD captures the size of the exposure at risk during a default.
PD, LGD, and EAD variables are vital for measuring both expected and unexpected losses. This concept is essential for a credit risk manager who desires to set capital buffers, price loans effectively, and maintain portfolio resilience.
In the next chapter, we explore how these inputs feed into more advanced metrics, thus equipping you to make sharper, risk-informed decisions.
About This Series
This article is part of Q-Lana's Credit Risk Concepts series, exploring the quantitative techniques that support pricing, capital planning, and performance measurement.
The complete series includes:
- Credit Risk Concepts: Introduction
- Expected Loss in Credit Risk: Formula, Calculation & Examples
- Unexpected Loss (UL): Capital Buffers, Calculation & Portfolio Implications
- Quantifying Capital Requirements for Individual Loans
- RAROC: How to Calculate Risk-Adjusted Return on Capital (With Worked Example)
- Credit Risk Series Summary, and this article.
Continue the Conversation
Talk to the team. Senior-to-senior. No sales call.
Subscribe to Q-Lana Weekly. One newsletter, five lenses, free, no paywall.
Read the related white paper. Frameworks built to be deployed.