RAROC: How to Calculate Risk-Adjusted Return on Capital (With Worked Example)
This final article in our Credit Risk Management series introduces RAROC and shows how it links credit risk to loan profitability, helping institutions guide pricing, optimize capital use, and align lending decisions with risk-return expectations.

In the previous chapters, we introduced Expected Loss (EL) and Unexpected Loss (UL), and examined how they are quantified at both portfolio and individual loan levels, plus how Basel III/IV inform capital adequacy standards. In this chapter, we shift from risk quantification to financial performance, focusing on Risk Adjusted Return on Capital (RAROC).
What is RAROC?
RAROC (Risk-Adjusted Return on Capital) is a metric that enables financial institutions to evaluate whether the return generated by a loan is adequate relative to the risk and capital it consumes: the link between risk and profitability.
From Loss Calculation to Loan Profitability
Previously, we explored the calculation of expected loss (EL) and unexpected loss (UL), and discussed how these metrics form the foundation of risk management. Expected loss, covered by reserves, represents the predictable cost of doing business, while unexpected loss, covered by equity capital, accounts for the volatility and uncertainty in credit risk outcomes. With these components quantified, we now turn to how they influence loan pricing and risk-adjusted profitability. Specifically, we’ll explore loan pricing and its impact on Risk Adjusted Return on Capital (RAROC).
The Four Components of Loan Pricing that Influence RAROC
To calculate profitability and RAROC, we first need to understand how a loan’s pricing is determined. The interest rate charged to the client typically consists of four key components:
i. Cost of Funding
This is the expense incurred to source the funds, whether from depositors, investors, or other banks. It’s typically managed by the Treasury Department, which determines transfer pricing and ensures liquidity
ii. Cost of Credit Risk
Calculated based on the Expected Loss (EL), this cost reflects the risk of lending and is derived from the Probability of Default (PD), Loss Given Default (LGD), and Exposure at Default (EAD).
iii. Operating Expenses
These are fixed costs such as salaries and administrative overhead. Unlike other components, operating expenses are usually expressed as a dollar amount rather than a percentage of the loan value.
iv. Profit Margin or Subsidy
This is the institution’s target profit or additional subsidy desired for specific transactions, as determined by management. Unexpected losses (UL) also indirectly influence pricing. Institutions with higher risk profiles may face higher funding costs, as lenders and investors perceive them as riskier. Similarly, riskier institutions may set higher profit margins to ensure adequate returns for their shareholders.
Calculating Profitability and RAROC
RAROC measures the profitability of a loan relative to the capital required to support it, incorporating two additional factors:
- Fee Income (additional fees earned)
- Capital Benefit (an adjustment for the portion of the loan funded by equity rather than debt).
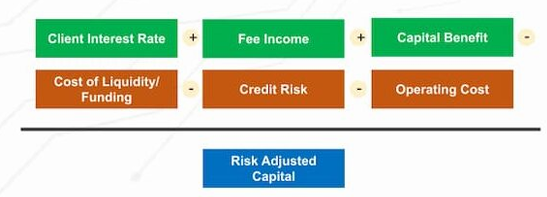
We calculate profitability by subtracting costs from revenues and dividing by the risk-adjusted capital.
How to Calculate RAROC in Loan-Level Analysis
To evaluate a loan’s profitability, we calculate the Risk Adjusted Return on Capital (RAROC). This metric helps determine whether the expected revenue from a loan justifies the capital at risk.
Example:
Let’s revisit our example loan with the following parameters:
- Loan Amount: $10,000
- Probability of Default (PD): 5%
- Loss Given Default (LGD): 40%
- Exposure at Default (EAD): 50%
- Maturity: 4 years
- Equity Capital Requirement: $966.49
Assuming a 10% interest rate, the first year’s interest revenue is $1,000. The capital benefit, based on the portion of the loan funded by equity, is $48.32. With funding costs at 5%, the cost of funding is $500. Adding $100 for expected loss and operating expenses brings total expenses to $900. The RAROC calculation is as follows.
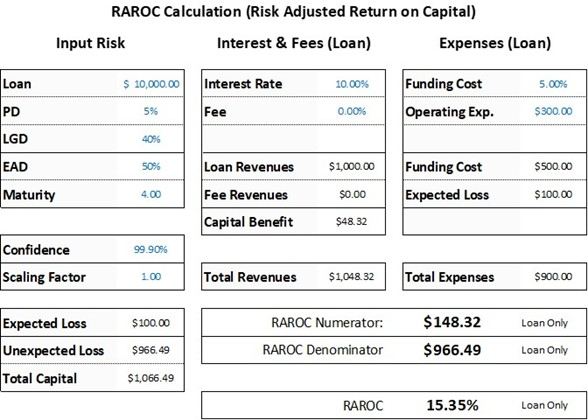
Whether this RAROC is acceptable depends on institutional targets and risk appetite, but this serves as a baseline for analysis.
RAROC Sensitivity Analysis
Sensitivity analysis allows financial institutions to understand how changes in various factors impact the Risk-Adjusted Return on Capital (RAROC) and overall profitability of loans.
i. Increasing Loan Amount
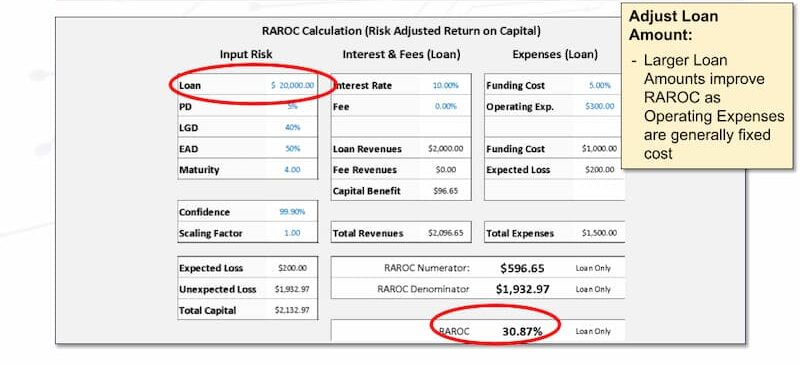
One way to improve RAROC is by increasing the loan amount. For example, if the loan size is doubled from $10,000 to $20,000, the RAROC rises significantly from 15.35% to 30.87%. This increase occurs because operating expenses, such as staff salaries or administrative costs, remain fixed regardless of loan size. Since these expenses do not scale with the loan amount, larger loans distribute these costs over a higher revenue base, improving profitability. However, institutions must balance this approach with the increased exposure and potential risk associated with larger loans.
ii. Improving Collateral Quality.
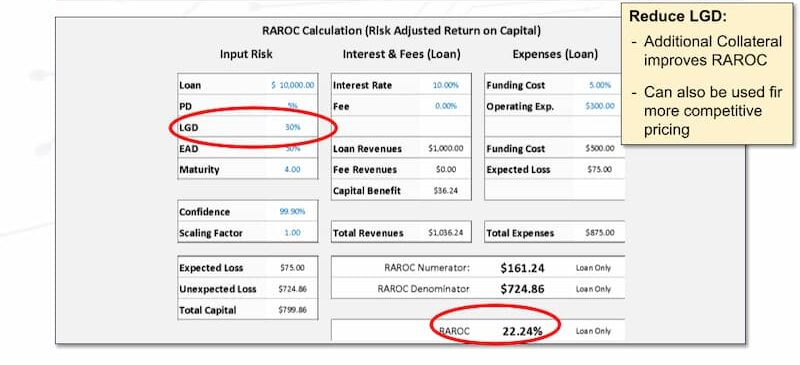
Another lever to enhance RAROC is improving the quality or quantity of collateral provided by borrowers. In our example, reducing the Loss Given Default (LGD) from 40% to 30% increases RAROC from 15.35% to 22.24%. This improvement reflects a lower potential loss in the event of default, reducing the expected loss component of the loan pricing. In practical terms, institutions can negotiate with borrowers to provide additional or higher-quality collateral, such as cash deposits or easily liquidated assets. Interestingly, this strategy also creates an opportunity to reduce the client’s interest rate, making the loan more attractive to the borrower while maintaining profitability.
iii. Leveraging Cross-Selling Opportunities.
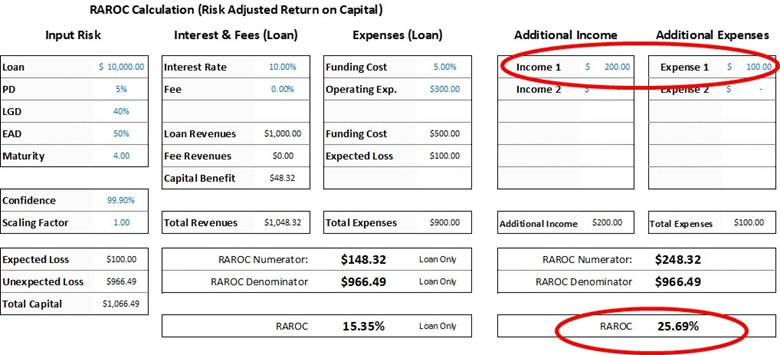
Cross-selling additional products or services to borrowers can also significantly enhance RAROC. For instance, offering a deposit or salary account alongside the loan generates additional income for the institution. Suppose the institution earns $200 in additional revenue with a cost-income ratio of 50%, resulting in $100 in additional expenses. In this case, the RAROC improved from 15.35% to 25.69%. Cross-selling not only boosts revenue but also deepens the client relationship, potentially leading to greater client retention and additional business opportunities over time.
Exploring Other RAROC Variables
Beyond the examples above, sensitivity analysis can be extended to other variables, such as interest rates, loan maturities, or borrower risk profiles.
For instance:
- Interest Rates: Increasing or decreasing the loan interest rate directly impacts revenue and profitability. For borrowers with strong credit profiles, institutions may reduce interest rates to remain competitive without significantly affecting RAROC.
- Loan Maturities: Adjusting the loan term affects the exposure at default (EAD) and, consequently, the expected loss (EL) and unexpected loss (UL). Institutions must carefully align loan maturities with their risk tolerance and liquidity needs.
Q-Lana automates RAROC calculation at the loan and portfolio level, giving credit committees a live view of risk-adjusted profitability before approval.
About This Series
This article is part of Q-Lana's Credit Risk Concepts series, exploring the quantitative techniques that support pricing, capital planning, and performance measurement.
The complete series includes:
- Credit Risk Concepts: Introduction
- Quantifying Credit Risk Using PD, LGD and EAD
- Expected Loss in Credit Risk: Formula, Calculation & Examples
- Unexpected Loss (UL): Capital Buffers, Calculation & Portfolio Implications
- Quantifying Capital Requirements for Individual Loans
- Credit Risk Series Summary, and this article.
Continue the Conversation
Talk to the team. Senior-to-senior. No sales call.
Subscribe to Q-Lana Weekly. One newsletter, five lenses, free, no paywall.
Read the related white paper. Frameworks built to be deployed.